
Insights
Find the latest news and insights from TrueShares below.
Uncapped Matters: Making the Most of the Market’s Best

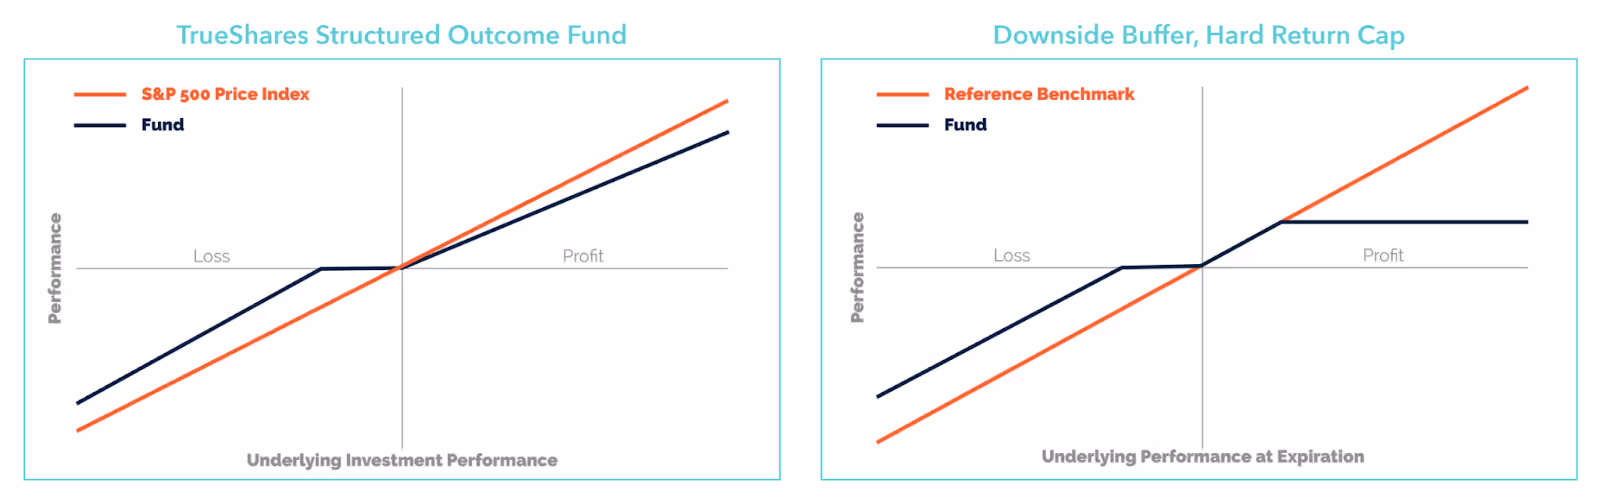
The TrueShares Structured Outcome ETF series utilizes a protective buffer strategy that buffers against the first 8-12% (with the advisor targeting 10%) of losses on the S&P 500 Price Index while providing investors with positive returns that track those of the Index. The intent of the ETFs in the series is to provide uncapped market upside participation with a measure of downside risk mitigation.
Most other buffer strategy products in the marketplace place a cap on the maximum amount of gains an investor can achieve along the Index. This cap usually falls around 15%, but can vary. The TrueShares Structured Outcome ETF Series, however, places no maximum cap on the gains an investor can achieve. This upside participation has significant impacts on an investor’s long-term earnings.
In a capped buffer ETF with a 15% cap, an investor gains the first full 15% of the market gains alongside the Index. Since 19571, the S&P 500 has gained between 0% and 15% annually 17 times. In that same period of time, the S&P 500 has gained more than 15% annually 32 times. Within those years of high return (>15%), the average return was 25.55%.
A capped buffer ETF means an investor misses out on the really good years in the 20, 30 and 40% return range while an uncapped buffered ETF provides gains far beyond the modest 15% to capture nearly all of the upside potential. And because both capped and uncapped buffered ETF investors have a similar downside buffer, the primary loss differential between the two is on the upside. Historically speaking, a large upside is far more common than a modest one.
History also suggests that “the market’s worst days tend to be followed by its best days.”2 An uncapped buffered ETF allows investors to rebound much stronger after a loss. If a loss exceeds a 10% buffer, an uncapped investor has an opportunity to make up for it on an upside swing exceeding 15%.
Investors who get spooked by downturns and pull out of the market also tend to miss the market’s best days in the oftentimes quick and unpredictable rebound. If we look at how the S&P 500 performed over the last 30 years3, we see an 8% average annual return. Investors who missed the 10 best days over the last 30 years only gained 5.26%3. Missing the 30 best days dropped gains to a mere 1.86% while missing the 50 best days yielded negative returns of -0.86%3. By lowering the cap on potential gains, an investor lowers their average returns over time. That’s why uncapped buffer ETFs matter.
- https://www.investopedia.com/ask/answers/042415/what-average-annual-return-sp-500.asp
- https://www.cnbc.com/2022/03/09/you-may-miss-the-markets-best-days-if-you-sell-amid-high-volatility.html
- https://www.cnbc.com/2024/03/07/why-bailing-on-the-stock-market-is-likely-a-losers-game-cfp-says.html
The TrueShares Structured Outcome ETFs have characteristics unlike many other traditional investment products and may not be suitable for all investors. You should only consider an investment in the Fund if you fully understand the inherent risks, which can be found in the prospectus.
TrueShares Structured Outcome ETFS are designed to seek to achieve the investment strategy for investments made on the Initial Investment Day and held until the last day of the Investment Period. Investors purchasing shares in the fund after its 12-month investment period has begun or selling share prior to the end of the investment period, may experience very different results than the fund’s stated investment objective. These periods begin at either the fund’s inception date or at each subsequent “Initial Investment Day”. Following the initial investment period after fund inception, each subsequent investment period will begin each year on the first day of the month the fund was incepted (subsequent “Initial Investment Days”). Fund management will target a 10% downside buffer, with expectations that it will generally fall between 8-12%. The Fund is not designed to protect against declines of more than 8-12% in the level of the S&P 500 Price Index, and there can be no guarantee that the Fund will be successful in implementing the buffer protect options strategy to avoid the first 8-12% decline.
Investments involve risk, including potential loss of principal. The Fund is recently organized with no operating history for prospective investors to base their investment decision which may increase risks. The Fund employs a buffered strategy in an attempt to buffer against losses in the S&P 500 Price Index over the course of a 1-year period. There is no guarantee the Fund will be successful in this strategy, and investors may experience losses beyond targeted levels. In the event an investor purchases Shares after the date on which the options were entered into or sells Shares prior to the expiration of the options, the buffer that the Fund seeks to provide may not be available and there may be limited to no upside potential. The Fund does not provide principal protection and an investor may experience significant losses on its investment, including the loss of its entire investment.
The Fund invests in options, which involves leverage, meaning that a small investment in options could have a substantial impact on the performance of the Fund. The Fund may invest in FLEX Options issued and guaranteed for settlement by the OCC. The Fund bears the risk that the OCC will be unable or unwilling to perform its obligations under the FLEX Options contracts. Additionally, FLEX Options may be illiquid, and in such cases, the Fund may have difficulty closing out certain FLEX Options positions at desired times and prices. As the options the Fund invests in derive their performance from the S&P 500 Price Index, the Fund is subject to the equity market risk associated with the index. The ETF’s portfolio is more volatile than broad market averages.
Additional risks of investing include management, non-diversification, portfolio turnover and tax risks. Detailed information regarding the specific risks of the funds can be found in the prospectus. Individual investors should contact their financial advisor or broker dealer representative for more information on TrueShares ETFs.


.jpg)
Thought Leadership,
Straight to Your Inbox
Disclosures
©2026, TrueShares, ©2026 TrueMark Investments, LLC. (“TrueMark”).
Before investing, carefully consider the TrueShares ETFs investment objectives, risks, charges and expenses. Specific information about TrueShares is contained in the prospectus and a summary prospectus, copies of which may be obtained by visiting www.www.true-shares.com. Read the prospectus carefully before you invest.
An investment in TrueShares is subject to numerous risks, including possible loss of principal. The ETFs are subject to the following principal risks: Authorized Participants, Market Makers, and Liquidity Providers Concentration Risk associated with ETFs; Equity Market Risk; Management Risk; Market Capitalization Risk (Large Cap; Mid Cap, Small Cap Stock); Market Risk; New Fund Risk: The Fund is a recently organized, non-diversified management investment company with no operating history. As a result, prospective investors have no track record or history on which to base their investment decision. Additionally, the Adviser has not previously managed a registered fund, which may increase the risks of investing in the Fund.
Depositary Receipts Risk. American Depositary Receipts (“ADRs”) have risks similar to those of foreign securities (political and economic conditions, changes in the exchange rates, etc.) and entitle the holder to all dividends and capital gains that are paid out on the underlying foreign shares.
Individual investors should contact their financial advisor or broker dealer representative for more information on TrueShares ETFs.
Investment Products and Services are: NOT FDIC INSURED / MAY LOSE VALUE / NO BANK GUARANTEE.
All registered investment companies, including TrueShares, are obliged to distribute portfolio gains to shareholders at year-end regardless of performance. Trading in TrueShares ETFs will also generate tax consequences and transaction expenses. The information provided is not intended to be tax advice. Tax consequences of dividend distributions may vary by individual taxpayer.
TrueShares ETFs are bought and sold through exchange trading at market price, not Net Asset Value (NAV), and are not individually redeemed from the fund. Shares may trade at a premium or discount to their NAV in the secondary market. Brokerage commissions will reduce returns.
ETF shares may be bought or sold throughout the day at their market price, not their NAV, on the exchange on which they are listed. Shares of ETFs are tradable on secondary markets and may trade either at a premium or a discount to their NAV on the secondary market. ETFs trade like stocks, fluctuate in market value and may trade at prices above or below the ETF’s NAV. Brokerage commissions and ETF expenses will reduce returns.
Fund Intelligence Mutual Fund Industry and ETF Award shortlists and winners are comprised of individuals and firms who have submitted entries or been nominated via the online submission process, as well as through recommendations from leading market participants. Fund Intelligence Mutual Fund Industry and ETF Award judges will use the submitted application material, as well as any uploaded supplemental information, to determine which firm, individual or product they believe to be the most suitable and deserving winners for each category. Fund Intelligence Mutual Fund Industry and ETF Award judges have the discretionary power to move nominations into alternative categories that they think may be more suitable. Fund Intelligence Mutual Fund Industry and ETF Awards were decided by an independent panel of 20 judges with expertise across the asset management space.
TrueShares ETFs (the “Funds”) are registered with the United States Securities and Exchange Commission under the Investment Company Act of 1940. The fund is distributed by Paralel Distributors LLC, Member FINRA. Paralel is not affiliated with TrueMark Investments, LLC. TrueMark Investments, LLC, is the investment advisor to the Funds and receives a fee from the Funds for its services.
TrueMark Investments, LLC is the investment advisor to the Funds and receives a fee from the Funds for its services.
TrueShares ETFs are offered only to United States residents, and information on this site is intended only for such persons. Nothing on this website should be considered a solicitation to buy nor an offer to sell shares of any fund in any jurisdiction where the offer or solicitation would be unlawful under the securities laws of such jurisdiction.