The abrupt return of equity market volatility has been a major investment consideration in 2020. Among the ten largest one-day increases in the CBOE Volatility Index over the last 30 years, 4 have happened (so far) this year.1 With ongoing uncertainty surrounding the timing of a coronavirus vaccine, employment concerns impacting consumer behavior and overall corporate profitability, not to mention potential election fallout, catalysts remain for significant market swings in the near- to mid-term.
Against this backdrop, investors are faced with additional challenges related to traditional choices for managing equity volatility. Diversifying further into fixed income is an option, but increased demand for this asset class would dampen return potential in an already historically low-interest rate environment. Shifting to cash is an extreme and short-sighted plan, particularly given that many investors need long-term growth and that the U.S. markets have shown notable resiliency in 2020. Furthermore, neither minimum volatility equity portfolios nor preferred stocks have provided the panacea.
Can Structured Outcome ETFs represent the missing portfolio ingredient? Let’s examine.
How Returns are Generated Matters
As we know from historical equity market performance, returns don’t happen in a linear fashion. Even though there has been a long-term positive return profile for equities, there are peaks and valleys, leading to what we often describe as a “lumpy†return experience. As part of that experience, the longer-term impacts of downside volatility can strongly influence overall performance results, especially as retiring investors begin drawing down their accounts.
To demonstrate this, the hypothetical illustration on the next page looks at two portfolios with identical annual rates of return but with different volatility characteristics. As we look at the results, we see the that impact of higher standard deviation on the first portfolio led to a complete drawdown of the account value, while the lower volatility profile of the second portfolio led to an ending value over $1 million dollars over the same time period.

2. Source: SpiderRock Advisors. For illustrative and discussion purposes only. Performance shown is hypothetical and based on certain assumptions. It does not represent the performance of any TrueShares fund. The illustration is meant to illustrate the impact of higher vs. lower volatility on overall account results when clients are making withdrawals. Performance shown is hypothetical and based on assumptions. As illustrated above, the key assumptions utilized in the analysis above include a.) holding equal geometric mean returns, initial annual withdrawal amounts, and annual cost-of-living adjustments to the annual withdrawals, and b.) the stated differences in the annual volatility (as represented by annual standard deviation) between the two investors’ portfolios. The returns streams used in this analysis are hypothetical and are not tied to, or meant to represent, any index or security. They are intended to solely represent a mathematical exercise. Results may vary with each use and over time. IMPORTANT: The projections or other information regarding the likelihood of various investment outcomes are hypothetical in nature, do not reflect actual investment results and are not guarantees of future results. There is no guarantee that the goal to seek less volatility would be achieved in any time frame. Market Risk is still present and investors may still be susceptible to general stock market fluctuations and to volatile increases and decreases in value as market confidence in and perceptions of their issuers change. These investor perceptions are based on various and unpredictable factors including: expectations regarding government, economic, monetary and fiscal policies; inflation and interest rates; economic expansion or contraction; and global or regional political, economic and banking crises.
The exercise above further supports exploring ways to lower portfolio equity volatility for investors that are utilizing their portfolio for income-generation purposes. These investors traditionally maintain growth components in their portfolios to help support cost-of living standards but at the same time generally have lower risk appetites. Add in the income-dampening effect of an ongoing low-rate environment and there emerges a case for exploring alternative sources of risk-managed returns.
Buffering Downside Exposure
Structured outcome strategies have been available in various structures for decades but have only recently started to arrive in lower-cost, higher-liquidity ETF structures. These products often offer a form of downside risk mitigation or “bufferâ€, seeking to protect investors against the first losses of a specific equity benchmark (ex. S&P 500, Nasdaq 100, Russell 2000) while offering upside participation to a specified level. This is achieved through a series of option sales and purchases to provide market exposure and establish both downside buffer and upside participation levels.
The concept is relatively simple but elegant: investors can choose a desired buffer level with the understanding that increased downside protection potential comes with the tradeoff of less upside participation. The availability of multiple buffer levels enables a variety of investors with different risk appetites the potential to find a strategy that fits their needs.
How We View Downside Buffers and Our Approach
At TrueShares, we’ve established a targeted 10% buffer (within a range of 8-12%) on the first losses of the S&P 500 Price Index in our Structured Outcome ETFs. This buffer level reflects our belief in a long-term, positive return bias for U.S. equity markets, and as a result, a need to maximize upside participation should markets enter a period of significant outperformance (keep an eye out for a related future post on upside participation strategies in buffered products). These “right-tail†events play an important role in the long-term performance advantage that equities have historically had when compared to many other asset classes.
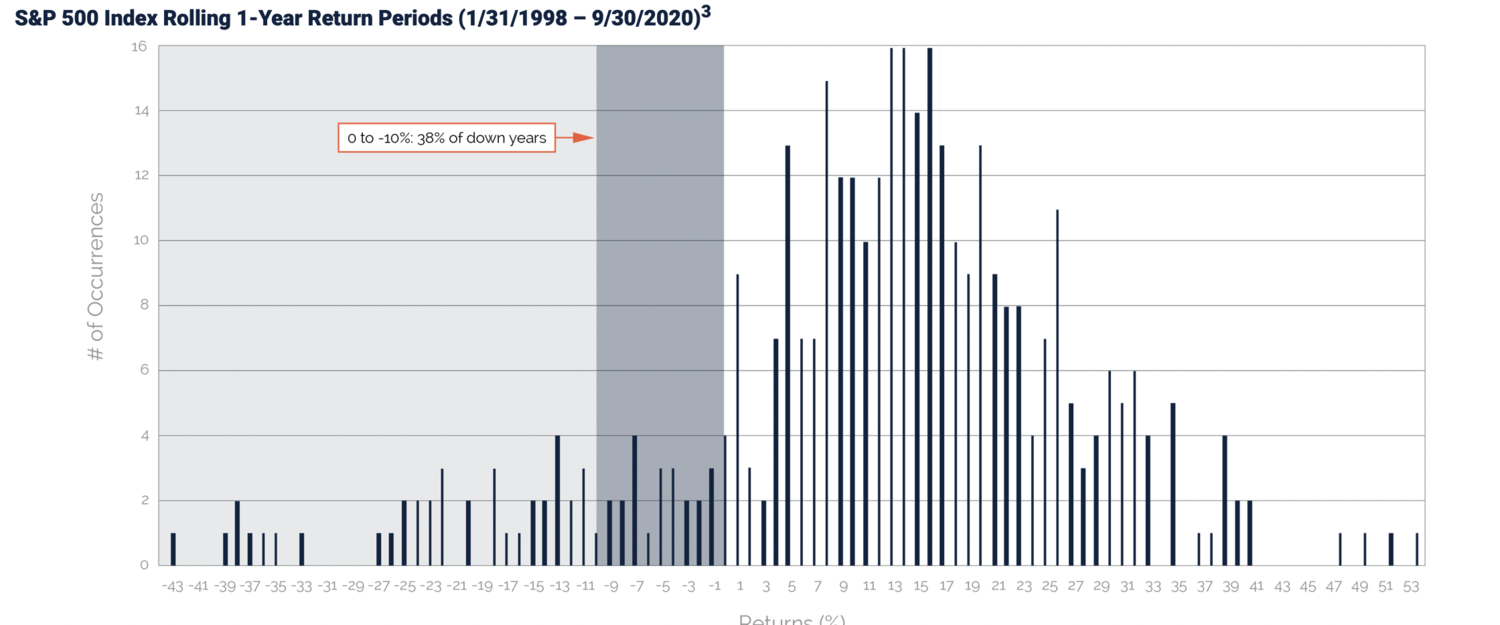
Focusing in on U.S. large-cap equities (represented by the S&P 500 Index), we chart a historical distribution of rolling 1-year returns on the following page. As we shift the lens onto down years, we see negative return periods occurred roughly 20% of the time. When negative years happened, approximately 40% of the time the annual decline ranged between 0 and -10%. For buffered strategies that cover that range, investors should expect they would avoid any of that selloff on a gross of fees basis. For negative returns beyond that level, investors would begin experiencing declines in their investment, but could anticipate still seeing overall performance benefits based on not participating in the initial selloff of the underlying benchmark.
Why a 10% Buffer Level?
With an understanding of this historical market behavior and augmented by empirical performance aggregation from our subadvisor, SpiderRock Advisors (an asset management company focused on custom option overlay strategies), we believe that the 10% buffer level over a one-year period represents an ideal risk-return tradeoff point, striking a balance between providing a degree of downside risk mitigation and seeking to maximize upside participation for our uncapped Structured Outcome strategy. For example, expanding the buffer level to 15% would lower upside participation potential to a degree that would offset any marginal benefit that came with the additional risk mitigation. With that said, we understand that additional buffer levels will be attractive to some investors who are more risk averse.
Additionally, as we look at institutional ownership of put options, the 10% out-of-the-money price level is a heavily traded area of the options market, resulting in opportunities for better liquidity and pricing for options transactions. While these are more nuanced reasons, they do potentially offer extra benefits to investors in products that are trading options in that strike price range.
Conclusion
Exposure to equities is a must-have for most investors seeking a growth component in portfolios. We believe that group of investors has grown in size due to the challenges of a low-interest rate environment. Yet expanding equity allocations can be stressful to more conservative investors. It’s our view that in those cases, advisors and investors should explore structured or defined outcome strategies, with a focus on identifying a comfortable tradeoff point between adding risk mitigation and still allowing for a significant level of upside participation
Footnotes
1. Source: Bloomberg, as of 9/30/2020. It is not possible to invest directly in an index.
3. For illustrative and discussion purposes only. Source: Bloomberg, as of 9/30/2020. Rolling returns shown in the chart represent 1-year returns measured on a monthly basis for the previous 1-year period, with the first return measured 01/31/1989. The lines in the chart represent the total number of occurrences for a given return percentage over the full date range noted. Index performance shown is for the S&P 500 Total Return Index and does not represent TrueShares fund performance. It is not possible to invest directly in an index. Values in the chart are rounded to the nearest whole percent. Performance data quoted above represents past performance and does not guarantee future results.