The RiverNorth Patriot ETF (BATS: FLDZ) was created with two goals in mind: to deliver to our investors a core portfolio of US-based stocks that primarily generate revenues within our borders and to support the Folds of Honor Foundation in their endeavor to provide life-changing scholarships to the spouses and children of America’s fallen or disabled military members.
Per the Fund’s prospectus, RiverNorth must donate a majority of its sub-advisory fee or 100% of the profit derived from its management of the Fund, whichever is greater, to the Folds of Honor Foundation. In 2022, we gave more than 100% of our sub-advisory fee to the Foundation, helping sponsor numerous educational scholarships. Yet, there is much more to do and your continued support of the Folds of Honor through your investment in the RiverNorth Patriot ETF (BATS: FLDZ) is not only appreciated by RiverNorth and the Folds of Honor, but also by the scholarship recipients who get an opportunity to achieve their goals in life, thanks to you.
To align the portfolio with our objective of helping those who have defended our country and freedoms, we invest exclusively in companies that generate at least 90% of their revenues within the United States and are principally traded and domiciled here. To focus on the subset of more developed and liquid American companies, we also exclude any that have a market capitalization of less than $5 billion at the time of selection.
As a result of the Fund’s mandate, there are some portfolio statistics worth noting. First, the Fund maintains a 99.6% geographic revenue exposure to the United States versus an estimated 60.0% for the S&P 900 – an active exposure of 39.6%. Second, the Fund’s weighting to the Technology sector is 2.1% versus an estimated 33.1% for the benchmark. The allocation in the Fund away from Technology and into other sectors is primarily a result of the large companies within this sector who have relatively low revenue exposure to the United States.
Looking to performance, the first half of this year yielded underwhelming results for the Fund as most broad equity markets have advanced strongly, with big tech companies leading the charge. Commensurately, the Fund’s aforementioned underweight to technology has dampened performance year-to-date. In addition to the tech underweight, the Fund maintains an equal-weight tilt in its allocation to American companies, providing strong diversification across the portfolio. While this is an attractive feature of the portfolio in our view, the equal-weighted S&P 500 index materially underperformed its cap-weighted contemporary year-to-date, which we believe further contributed to the negative performance gap versus the broader benchmark index over the period. In support of this notion, the S&P 500 index returned +16.89% over the period where the S&P 500 Equal Weighted index returned only +7.03%, indicating that much of the strength in the cap-weighted index is coming from its most heavily-weighted companies.
As shown in the cumulative return chart below, FLDZ consistently remained atop the S&P 900 throughout 2022 but as markets absorbed the impact of the regional banking crisis in March 2023, performance began to trail the benchmark index due to the Fund’s overweight to the finance sector. Since its inception on December 31, 2021, FLDZ has produced an annualized net total return of -5.48% versus the S&P 900 gross total return of -2.92%. On a year-to-date basis, these returns are +4.33% and +16.41%, respectively.
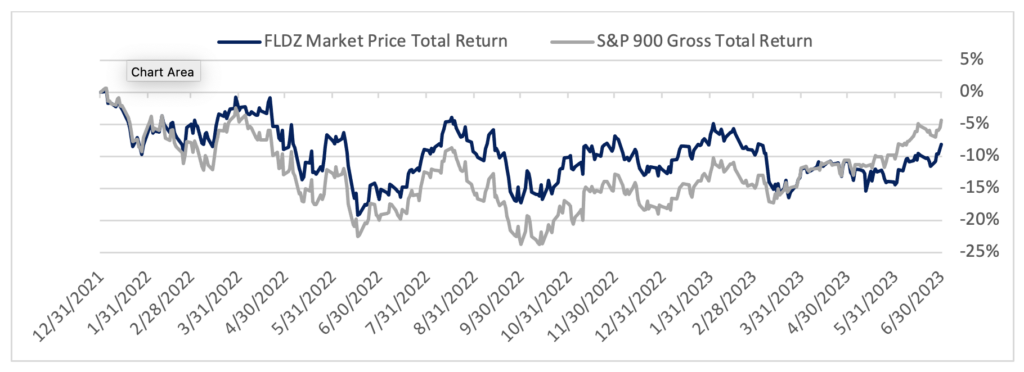
Source: RiverNorth, FactSet. FLDZ performance is calculated net of fees. Performance data quoted above represents past performance and does not guarantee future results. Investment return and principal value of an investment will fluctuate so that an investor’s shares, when redeemed or sold in the secondary market, may be worth more or less than the original cost. Investors will incur usual and customary brokerage commissions when buying or selling shares of the exchange traded funds (“ETFs”) in the secondary market, and that, if reflected, the brokerage commissions would reduce the performance returns. Current performance may be lower or higher than the performance shown. Shares are bought and sold at market price not net asset value (“NAV”) and are not individually redeemable from the fund. Call 877.774.TRUE for more information. To view the factsheet, click here. Standardized and monthly performance is available here: https://www.true-shares.com/fldz/
In analyzing the Fund’s performance attribution versus its benchmark over the last 12 months (below), we can see that the portfolio’s allocation differences negatively impacted relative performance materially in both March and May 2023. Conversely, these allocation differences have also helped over the last 12 months at different times where either underweighted sectors underperformed or overweighted sectors outperformed. Taking a second glance at the data below, we can see the portfolio’s stock selection does not appear to have been as much of a driver of returns, in aggregate, as the differences in sector allocation.
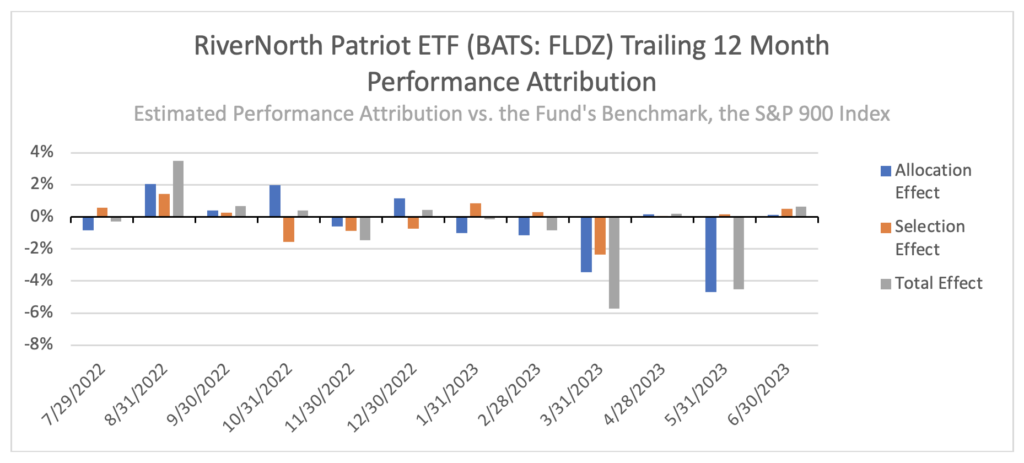
Source: RiverNorth, FactSet. Figures are estimates and are subject to change. Performance data quoted above represents past performance and does not guarantee future results. Investment return and principal value of an investment will fluctuate so that an investor’s shares, when redeemed or sold in the secondary market, may be worth more or less than the original cost. Investors will incur usual and customary brokerage commissions when buying or selling shares of the exchange traded funds (“ETFs”) in the secondary market, and that, if reflected, the brokerage commissions would reduce the performance returns. Current performance may be lower or higher than the performance shown. Shares are bought and sold at market price not net asset value (“NAV”) and are not individually redeemable from the fund. Call 877.774.TRUE for more information. Standardized performance is available here: https://www.true-shares.com/fldz/
Below are the Fund’s estimated top-level characteristics versus the benchmark, as of 6.30.2023. Here we can see the Fund’s higher dividend yield, lower price-to-book and lower price-to-earnings ratios versus the benchmark. We view these differences as indicators of the Fund’s slight tilt to value stocks. Furthermore, we believe the portfolio’s tilt toward the value factor was a strength in its inaugural year and will likely add some protection to the portfolio should a US recession occur. With dramatic yield curve inversion, tightening credit standards, persistent inflation, and bubbling geopolitical tensions, there are many potential catalysts for the defensive elements of the portfolio to outperform in the future.
| Characteristics | FLDZ | S&P 900 |
| General | ||
| Number of securities | 280 | 904 |
| Weighted average market cap ($M) | 25,273 | 641,766 |
| Median market cap ($M) | 12,224 | 11,994 |
| Fundamental | (%) | (%) |
| 30 day SEC yield | 1.8 | — |
| Weighted average dividend yield | 2.5 | 1.5 |
| Price/earnings | 12.0 | 22.8 |
| Estimated 3-5 year EPS growth | 12.0 | 12.5 |
| Price/cash flow | 8.0 | 13.7 |
| Price/book | 2.4 | 3.9 |
| Price/sales | 1.3 | 2.4 |
| ROE (Return on Equity) | 18.2 | 24.4 |
| Source: RiverNorth, FactSet. Figures are estimates and are subject to change. Please see definitions below. | ||
In conclusion, RiverNorth, TrueShares and the Folds of Honor continue to appreciate your investment in our effort to give back to those that have given us everything. We encourage you to share the message of hope and opportunity that the Folds of Honor organization seeks to uplift in our society and hope you have an excellent rest of the year.
Definitions:
The S&P 900 is a stock market index that measures the stock performance of 900 large companies listed on stock exchanges in the United States.
The S&P 500 is a stock market index that measures the stock performance of 500 large companies listed on stock exchanges in the United States. It is one of the most commonly followed equity indices, and many consider it to be one of the best representations of the
U.S. stock market.
The S&P 500 Equal Weight index is an equal-weight version of the popular S&P 500 Index.
The S&P 900 is a stock market index that measures the stock performance of 900 large companies listed on stock exchanges in the United States.
30 day SEC yield: A calculation based on a 30-day period ending on the last of the month. It is computed by dividing the net investment income per share earned during the period by the maximum offering price per share on the last day of the period.
Weighted average dividend yield: Weighted average of all portfolio constituent dividend yield ratios based on each constituent’s weight in the portfolio.
- Dividend Yield = Divi/Pi
- Divi := Annual dividends per share (DPS) for security i as of the report date
- Pi := Closing price of security i as of the report date
Price/earnings: Weighted average of all portfolio constituent price to earnings ratios based on each constituent’s weight in the portfolio.
- Price to Earnings = Pi/EPSi
- Pi := Price for security i as of the report date
- EPSi := Last 12 months EPS of security i as of the report date
Estimated 3-5 year EPS growth: Weighted average of all portfolio constituent estimated 3-5 year EPS growth rates based on each constituent’s weight in the portfolio. FactSet, First Call, I/B/E/S Consensus, and Reuters provide FactSet with a pre-calculated mean long-term EPS growth rate estimate, which is calculated using each individual broker’s methodology.
Price/cash flow: Weighted average of all portfolio constituent price to cash flow ratios based on each constituent’s weight in the portfolio.
- Price to Cash Flow = Pi/CFi
- Pi := Price for security i as of the report date
- CFi := Cash flow per share of security i as of the report date
Price/book: Weighted average of all portfolio constituent price to book ratios based on each constituent’s weight in the portfolio.
- Price to Book Value = Pi/BVi
- Pi := Price for security i as of the report date
- BVi := Book value per share of security i as of the report date
Price/sales: Weighted average of all portfolio constituent price to sales ratios based on each constituent’s weight in the portfolio.
- Price to Sales = Pi/Salesi
- Pi := Price for security i as of the report date
- Salesi := Sales per share for security i as of the report date
ROE (Return on Equity): Weighted average of all portfolio constituent return on equity figures based on each constituent’s weight in the portfolio.
- Return on Equity (ROE) = NIi/TEi
- NIi := Net income of security i as of the report date
- TEi := Total equity of security i as of the report date
Before investing you should carefully consider the Fund’s investment objectives, risks, charges, and expenses. This and other information is in the prospectus. This material must be preceded or accompanied by a prospectus. Please read the prospectus carefully before you invest. You can access the prospectus here.
The Fund may not achieve its objective and/or you could lose money on your investment in the Fund. The Fund is recently organized with no operating history for prospective investors to base their investment decision which may increase risks. Some of the Fund’s key risks, include but are not limited to the following risks. Please see the Fund’s prospectus for further information on these and other risk considerations.
ETF Risks. As an ETF, the Fund is exposed to the additional risks, including: (1) concentration risk associated with Authorized Participants, market makers, and liquidity providers; (2) costs risks associated with the frequent buying or selling of Fund shares; (3) market prices may differ than the Fund’s net asset value; and (4) liquidity risk due to a potential lack of trading volume.
The TrueShares RiverNorth Patriot ETF is also subject to the following risks: Equity Market Risk – securities held in the Fund’s portfolio may experience sudden, unpredictable drops in value or long periods of decline in value. Market Events Risk – markets have experienced significant periods of volatility in recent years due to a number of economic, political and global macro factors, including the impact of the coronavirus (COVID-19) pandemic and related public health issues, growing concerns and uncertainties regarding interest rates, trade tensions and the threat of tariffs resulting in volatility and negative impacts on asset prices, liquidity of certain securities and normal operations of the securities markets. New Fund Risk – The Fund is a recently organized investment company with no operating history. Other Potential Risks – The Fund may invest in “when-issued” securities; preferred stocks; rights/warrants; tracking stocks; investment company securities/pooled investments; REITs; and repurchase agreements.
An investment in True-Shares is subject to numerous risks, including possible loss of principal. The ETFs are subject to the following principal risks: Authorized Participants, Market Makers, and Liquidity Providers Concentration Risk associated with ETFs; Equity Market Risk; Management Risk; Market Capitalization Risk (Large Cap; Mid Cap, Small Cap Stock); Market Risk; New Fund Risk; and Cyber Security Risk.
The ETF is benchmark agnostic and corresponding portfolios may have significant non-correlation to any index. Foreside Fund Services LLC, distributor.
NOT FDIC INSURED — NO BANK GUARANTEE — MAY LOSE VALUE